

Welcome to This Week in Social Science! In 2024, 22.7 million households in the U.S., or 49% of rental households, were spending more than 30% of income on rent and utilities. More than half of those were spending more than 50% of their income on rent.1 One step that some cities can take to address rising rental costs is to hold down costs through rent control policies. However, critics argue that rent control can harm the housing market by disincentivizing upkeep of rental units and by reducing the benefits of making new apartments available. In this episode, we look at two recent articles reviewing the impacts of rent control on housing and renters.
Rent Control and Affordable Housing
A team of researchers developed novel datasets to determine the effects of rent control policies across 27 metropolitan areas in the United States. They started by using machine learning algorithms to review news articles about rent control reforms across the 27 metropolitan areas between 2000 and 2021, and then they analyzed data from the U.S. census to identify the number of rental units available in each area and who could afford them.
Their analysis showed that rent-control policies had an overall negative effect on the availability of rental units, decreasing units available for rent by 10.4%. However, that reduction included a 52.3% increase in units available to the lowest-income households, offset by losses to higher-income households, including a 46.2% reduction in affordable housing for the highest-earning income households.2
Rent Control and Mobility
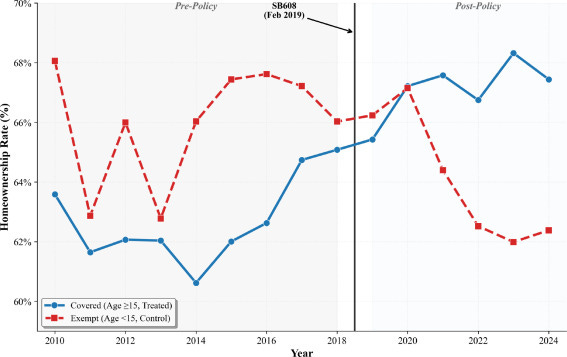
In 2019, the state of Oregon passed legislation constraining annual rental increases to 7%, plus local inflation. Research released this year looked at the impact of this legislation on housing mobility: the rate at which people moved to different housing. The results of the study showed that rent control affected both housing mobility, and homeownership.
First, people living in buildings affected by rent control were 33-62% less likely to move over one-, two-, and three-year horizons. This might indicate that some people who would otherwise have found different or better housing are choosing not to do so to avoid higher rent, or that people who might have been forced out without rent control are able to retain their apartments.
Second, there was an 8% increase in homeownership in the buildings affected by rent control, which could indicate either that renters are switching to ownership now that landlords can’t earn as much through rent, or that landlords are choosing to sell units rather than rent them, and thereby reducing the overall stock of units available for rent.3
Takeaway
The relationship between renters, landlords, and the government is dynamic. While rent control and rent freezes may protect renters from unmanageable increases in their rent, there are also downstream effects in the willingness of landlords to rent out units, which may decrease overall supply. In order to successfully keep down rental costs while also ensuring sufficient housing options, policymakers may need to pair rent control with other policies aimed at encouraging landlords and developers to make new units available for rent.
America’s rental housing 2026. Joint Center for Housing Studies. https://www.jchs.harvard.edu/americas-rental-housing-2026
Stacy, C., Hodge, T. R., Komarek, T. M., Davis, C., Stern, A., Noble, O., ... & Rogin, A. (2025). Rent control and the supply of affordable housing. Journal of Housing Economics, 68, 102063.
Tarabeih, A. (2026). Rolling windows, closed doors: Mobility and tenure effects of Oregon’s statewide rent stabilization policy. Journal of Housing Economics, 102162.
I don't know what to make of the graph showing the homeownership rate and the timing of SB608. It looks like buildings covered or exempted were already on different trajectories before SB608. What do you make of it?